
Wednesday, November 19, 2008
Falling Back
From 1950 to 1999 the infant mortality rate declined from 23 to 7.1 deaths per 1,000 live births. Much of this decline was realized between 1950 and 1985, but there continued to be a modest decline throughout the 1990s. Unfortunately, since 2000 the infant mortality rate in the United States has been stable, while it has continued to improve elsewhere. Thus the United State’s dropped from 23rd in 2000 to 29th in 2007. Now the United States is tied with Poland and Slovakia and ranks just above Puerto Rico.


Thursday, October 23, 2008
Infant Mortality -- Strangely High in the USA
A recent report from the National Center for Health Statistics reports that the infant mortality rate in the United States is 6.9 infant deaths per 1,000 births. This is surprisingly high given the level of economic development in the United States in 2004. Indeed, "the United States’ international ranking fell from 12th in 1960 to 23d in 1990, and to 29th in 2004."
The United States is 29th? That seems low, doesn't it?

The United States is 29th? That seems low, doesn't it?
Wednesday, July 2, 2008
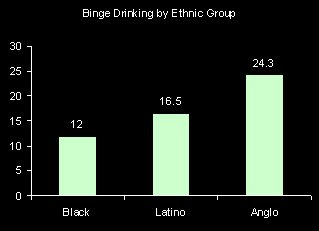
Who Binge Drinks?
Binge drinking is often defined as having 5 or more drinks in a day. According to the National Center for Health statistics the proportion of people who binge drank at least once in the last year was 20.7%. Men are more than two times more likely to have binged and young adults are more likely than older folks. There are also fairly large race-ethnic differences. Anglos (i.e. Non-Hispanic whites) are twice as likely as African Americans to have binge drank in the last year.

Monday, June 30, 2008
How much of income is spent on housing?
Common wisdom says that one should spend no more than 30 percent of the family income on housing. The American Community Survey provides information on housing costs as a percentage of income by age. It's clear from these numbers, presented in a graph below, that in 2006 many people were spending over 35% of their income on housing, particularly those in young adulthood and households headed by a retiree.

Friday, June 27, 2008
Increasing health care costs
Over the past 10 years the percentage of people who did not seek medical care because of costs has been rising, according to a recently released report by the CDC. This increase can not be explained because of aging, because the graph below is "age adjusted" and still shows this trend. There are a couple of other possible explanations, however. It might be that the percentage of people without insurance is increasing. Although this graph from the report suggests that the percentage of people without health insurance has been roughly flat over this period, the proportion insured among those age 18-64 has been declining (while the proportion of children insured has been increasing). Another possible explanation could be that health care costs have risen, or that other cost (like food and gas?) are on the rise, squeezing the family budget.
It also could be that we are just clumsier today than we were 10 years ago.
It also could be that we are just clumsier today than we were 10 years ago.
Thursday, June 26, 2008
Got Art?
In 2006 the General Social Survey asked respondents whether they saw themselves as having few artistic interests. The graph below presents their responses. We can see fluctuations by age. Generally, young adults often have artistic interests, and this sharply declines in what one might refer to as the early career stage (age 25-44). After this stage, the proportion saying that they don’t have artistic interests declines up until retirement. After retirement, the artistic folks seem to suddenly decrease.
This led me to wonder whether artistic people are more likely to die young. Or have there been cohort changes in artistic interests so that (for example) those born during the depression (age roughly 66-76 in 2006) were less interested in art? The fact that the proportion with artistic interests increases after age 75 makes me think this might be a cohort phenomenon.
This led me to wonder whether artistic people are more likely to die young. Or have there been cohort changes in artistic interests so that (for example) those born during the depression (age roughly 66-76 in 2006) were less interested in art? The fact that the proportion with artistic interests increases after age 75 makes me think this might be a cohort phenomenon.

My interpretation might also be swayed by the fact that I have artistic interests.
Wednesday, June 25, 2008
Which states are the “healthiest”?
The answer probably depends to some extent on what you use as a measure of health, but death rates seem like a pretty good indicator. According to the most recent death statistics released by the National Center for Health Statistics, the states with the lowest age-adjusted death rates are Hawaii, Minnesota, California, and New York (from low to not quite as low). The states with the highest age-adjusted death rates are Mississippi, Alabama, West Virginia, Louisiana, and Oklahoma (from extremely high to not quite as high). I guess it is either very good or very bad to live on a coast. I'd wonder if the Gulf of Mexico were toxic, except that Florida falls right after New York in the list of low death rate states.
Probably more relevant, a characteristic that all the states with the high mortality rates share is relatively low levels of education.
Perhaps it is some consolation to Oklahoma that they currently have unusually low unemployment rates?
Probably more relevant, a characteristic that all the states with the high mortality rates share is relatively low levels of education.
Perhaps it is some consolation to Oklahoma that they currently have unusually low unemployment rates?
Tuesday, June 24, 2008
Plenty of work?
One curious inconsistency noted by yesterday’s comment, is the fact that there are many jobs that go unfilled. How can the unemployment rate increase while jobs are available? One answer to this question is that it takes some time to someone to respond to an advertisement and be hired. Another, even more important factor, is that there is a mismatch between the characteristics of the unemployed and the characteristics of the jobs available. The unemployment rate is much, much higher for teens and for those with lower levels of education (see graph below). Another form of mismatch is between the location of the employer and the location of the employee. This is especially important now that gas prices are so high and commuting costs are higher. If the salary doesn’t cover the costs of being employed, an potential worker can not afford to take the job.

Monday, June 23, 2008
May Unemployment by State
On Friday the Bureau of Labor Statistics released May 2008 unemployment statistics by states. About a month ago, I posted the April figures. In April, California, Michigan, Rhode Island, Alaska, and Washington D.C. had the highest levels of unemployment. Between April and May, Rhode Island experienced the highest gains in unemployment and now sits with a 7.2% unemployment rate, and Alaska had the second-highest unemployment rate at 7.0%. In contrast, Oklahoma continued to enjoy declines in unemployment and now has a 3.5% unemployment rate, down from 4.5% in April.


Friday, June 20, 2008
Families with children
How many parents do children typically live with? Today, it is still the case that most children (almost 60%) are in families with two parents.


Of course, some of these families have a mother who is married to someone other than the biological father of their children. In this case, the family would be a married couple family, according to the census bureau definitions. It's still relatively rare for children to live with unmarried fathers, but it's only about half the percentage living with lone mothers (12 versus 22 percent). The difference is (as explained here) that many of the lone fathers are cohabiting with the child's mother.
Thursday, June 19, 2008
Where do you get your news?
The 2006 General Social Survey asked respondents “Where do you get your news?” Their responses indicate that television continues to play an important role, with just about half stating that it is their primary source. Coming in second were newspapers, magazines and books, with newspapers dominating this category. The internet was the third most common response, with 14% getting their news mostly from the internet (like me).
Favored media vary considerably by level of education. Television is preferred by everyone, but much more so at lower education levels. As education increases use of written sources and the internet increases.
Favored media vary considerably by level of education. Television is preferred by everyone, but much more so at lower education levels. As education increases use of written sources and the internet increases.

Wednesday, June 18, 2008
Fewer die of the flu
In an earlier post I listed the 15 leading causes of death in 2005. A recent report by NCHS updates this list from 2006 death rates. According to these most-recent death statistics, Alzheimers passed diabetes to become the sixth leading cause of death. This was because the death rate for Alzheimers dropped by only 0.9%, while the death rate for diabetes dropped by 5.3%. The largest drop in the death rate was for Influenza and Pnemonia, 12.8. I guess either folks got their flu shots in 2006 or the flu was not especially virulent that year.
Tuesday, June 17, 2008
High School Graduation Rates
The National Center for Education Statistics reports trends in the high school graduate rate since 1969. This is calculated as the percentage of students who start high school that have received their regular diploma (i.e. not a GED) 4 years later. The estimates for most recent years (the yellow part of the graph below) are projections, since those who started high school in 2005 haven’t had 4 years to complete their degree. The first thing that strikes me is the overall flatness of the line. Overall, levels of education are increasing and those not achieving a high school diploma are excluded from many jobs. GEDs can make up some of the difference, but previous research suggests that the employment characteristics of those with GEDs are more similar to those with no certification than those with a regular diploma. That high school graduation rates went up from the late 1990s to 2005 is promising, but recent declines lead me to question whether these improvements can be maintained.

Importantly, until recently the federal government reported graduation rates above 80%, but some claim that the actual rate is under 70%. One issue was that accountability systems have schools and districts calculating rates at the local level. This raises a problem when struggling students leave one school to attend another. The original school does not consider him a drop out, but the new school wouldn’t have this student included as a member of the freshman class. Another is the tendency to remove students who receive GEDs from the statistical system or to count them as graduates. As stated above GEDs are not equivalent to high school diplomas. A third issue is raised by special education students. Ambiguities allow officials to manipulate the numbers to present their schools and districts in the most positive light.
Given the importance of earning a high school diploma and the unremarkable record of the United States educational system in bringing students up to this minimal standard of competency, it is important for us to invest in the federal educational data system.

Importantly, until recently the federal government reported graduation rates above 80%, but some claim that the actual rate is under 70%. One issue was that accountability systems have schools and districts calculating rates at the local level. This raises a problem when struggling students leave one school to attend another. The original school does not consider him a drop out, but the new school wouldn’t have this student included as a member of the freshman class. Another is the tendency to remove students who receive GEDs from the statistical system or to count them as graduates. As stated above GEDs are not equivalent to high school diplomas. A third issue is raised by special education students. Ambiguities allow officials to manipulate the numbers to present their schools and districts in the most positive light.
Given the importance of earning a high school diploma and the unremarkable record of the United States educational system in bringing students up to this minimal standard of competency, it is important for us to invest in the federal educational data system.
Monday, June 16, 2008
And still a long way to go, baby
Although occupational segregation by gender has declined in recent years, a persistent area where women continue to be under-represented is in Science, Technology, Engineering, and Math (STEM) occupations. Women make up 46 percent of the labor force and 56 percent of all professional occupations, but only 30 percent of “computer and mathematical” occupations and 13 percent of “architecture and engineering” occupations. In contrast, women make up 80% of health technologists and technicians and 75 % of workers in office and administrative support occupations (2000 Census).
Friday, June 13, 2008
Increasing Diversity
The American Community Survey, conducted by the Census Bureau, provides yearly updates on the population characteristics of the U.S. In an earlier post I described the race-ethnic diversity of the U.S. population as of 2006. Now, 2007 estimates are available. Between 2006 and 2007 the overall population grew by 0.74%, but of course some groups grew faster than others. For example the non-Hispanic white population grew by only 0.17%, but the Hispanic population grew by 2.67 %


Thursday, June 12, 2008
Living Longer
Back in April, I posted a graph of trends in life expectancy, which shows that white women have the longest life expectancy, but other groups are catching up. Yesterday the National Center for Health Statistics released mortality data for 2006. Death rates declined and life expectancy is at an all-time high, 78.1 years. Life expectancy increased the most for black men, from 69.5 in 2005 to 70.0 in 2006. Even so, African American men still have the lowest life expectancy at birth.

Wednesday, June 11, 2008
Smokin'
The National Center for Health Statistics periodically produces accounts of the nation’s health. In these reports there’s a lot of information on things ranging from joint pain to psychological distress. Here we can find trends in the percentage of people age 25 and over who are current smokers by education. The good (and not very surprising) news is that smoking has declined. Also, only 8 percent of people with a Bachelor’s degree smoke. Less promising is the fact that smoking is more prevalent among the less educated and the declines in smoking over the last 20 years have been less steep. 

Tuesday, June 10, 2008
Graduation Rates
A report released last week by the National Center for Education Statistics describes graduation rates for the cohort that entered Title IV institutions in 2000. On average only 36 percent of those starting college in 2000 had received their Bachelor’s degree after 4 years. This increased to 53 after 5 years. Private not-for-profit schools have better graduation rates than public institutions or for-profit schools. Perhaps this is because private schools are more selective? It seems to me more likely that students get through more quickly because tuition is a lot higher and also because these schools typically provide better services to students. 

Monday, June 9, 2008
Teens and Immigrants especially hard hit by weak economy
On Friday June 6th, the Bureau of Labor Statistics released the May 2008 unemployment figures. Headlines noted the results as evidence of the weak economy, the stock market tanked (probably more on oil prices than unemployment figures), and many noted that the .5% increase in the unemployment rate was the greatest increase since 1986.
Of course, economic downturns are not felt equally across the economic (or demographic) spectrum. The BLS press release clearly indicates that those age 16-19 experienced the greatest increase in (seasonally adjusted) unemployment from April (15.4) to May (18.7). Yes, that’s right, teenagers experienced a whopping 3.3% point increase in unemployment in May.
Now, teens aren’t a large proportion of the labor force and adult men and women also experienced increases in unemployment, although these increases where much smaller (.3% and .5% respectively).
If you have a teen who is frustrated with their attempts to find a summer job, cut him/her a break! The graph below depicts the (seasonally adjusted) May unemployment rates from 1998 to the present. Clearly the last two years have NOT been good.
Of course, economic downturns are not felt equally across the economic (or demographic) spectrum. The BLS press release clearly indicates that those age 16-19 experienced the greatest increase in (seasonally adjusted) unemployment from April (15.4) to May (18.7). Yes, that’s right, teenagers experienced a whopping 3.3% point increase in unemployment in May.
Now, teens aren’t a large proportion of the labor force and adult men and women also experienced increases in unemployment, although these increases where much smaller (.3% and .5% respectively).
If you have a teen who is frustrated with their attempts to find a summer job, cut him/her a break! The graph below depicts the (seasonally adjusted) May unemployment rates from 1998 to the present. Clearly the last two years have NOT been good.

Thursday, June 5, 2008
Adolescent Health
A report on adolescent health published by the National Center for Health Statistics presents interesting facts about adolescent risk-taking. One positive trend has been a decline in the proportion of teens that ride in a car as a passenger without using a seatbelt. Only 10 % say that rarely or never wore a seatbelt. Somewhat more disappointing is the proportion that says that they rode with a driver who had been drinking (28.5%).
That’s probably because drinking is fairly common among teens old enough to drive a car. Over 30 percent of 16-17 year old teens have had a drink in the last 30 days and this percentage goes up to 50 percent among those age 18-19. My guess is that these kids aren't drinking at home.

That’s probably because drinking is fairly common among teens old enough to drive a car. Over 30 percent of 16-17 year old teens have had a drink in the last 30 days and this percentage goes up to 50 percent among those age 18-19. My guess is that these kids aren't drinking at home.

Subscribe to:
Posts (Atom)


