
Wednesday, July 2, 2008
Who Binge Drinks?
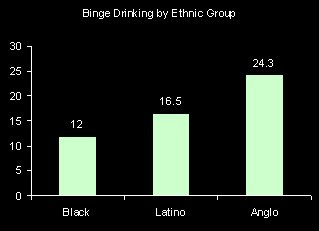
Binge drinking is often defined as having 5 or more drinks in a day. According to the National Center for Health statistics the proportion of people who binge drank at least once in the last year was 20.7%. Men are more than two times more likely to have binged and young adults are more likely than older folks. There are also fairly large race-ethnic differences. Anglos (i.e. Non-Hispanic whites) are twice as likely as African Americans to have binge drank in the last year.


Monday, June 30, 2008
How much of income is spent on housing?
Common wisdom says that one should spend no more than 30 percent of the family income on housing. The American Community Survey provides information on housing costs as a percentage of income by age. It's clear from these numbers, presented in a graph below, that in 2006 many people were spending over 35% of their income on housing, particularly those in young adulthood and households headed by a retiree.

Friday, June 27, 2008
Increasing health care costs
Over the past 10 years the percentage of people who did not seek medical care because of costs has been rising, according to a recently released report by the CDC. This increase can not be explained because of aging, because the graph below is "age adjusted" and still shows this trend. There are a couple of other possible explanations, however. It might be that the percentage of people without insurance is increasing. Although this graph from the report suggests that the percentage of people without health insurance has been roughly flat over this period, the proportion insured among those age 18-64 has been declining (while the proportion of children insured has been increasing). Another possible explanation could be that health care costs have risen, or that other cost (like food and gas?) are on the rise, squeezing the family budget.
It also could be that we are just clumsier today than we were 10 years ago.
It also could be that we are just clumsier today than we were 10 years ago.
Thursday, June 26, 2008
Got Art?
In 2006 the General Social Survey asked respondents whether they saw themselves as having few artistic interests. The graph below presents their responses. We can see fluctuations by age. Generally, young adults often have artistic interests, and this sharply declines in what one might refer to as the early career stage (age 25-44). After this stage, the proportion saying that they don’t have artistic interests declines up until retirement. After retirement, the artistic folks seem to suddenly decrease.
This led me to wonder whether artistic people are more likely to die young. Or have there been cohort changes in artistic interests so that (for example) those born during the depression (age roughly 66-76 in 2006) were less interested in art? The fact that the proportion with artistic interests increases after age 75 makes me think this might be a cohort phenomenon.
This led me to wonder whether artistic people are more likely to die young. Or have there been cohort changes in artistic interests so that (for example) those born during the depression (age roughly 66-76 in 2006) were less interested in art? The fact that the proportion with artistic interests increases after age 75 makes me think this might be a cohort phenomenon.

My interpretation might also be swayed by the fact that I have artistic interests.
Wednesday, June 25, 2008
Which states are the “healthiest”?
The answer probably depends to some extent on what you use as a measure of health, but death rates seem like a pretty good indicator. According to the most recent death statistics released by the National Center for Health Statistics, the states with the lowest age-adjusted death rates are Hawaii, Minnesota, California, and New York (from low to not quite as low). The states with the highest age-adjusted death rates are Mississippi, Alabama, West Virginia, Louisiana, and Oklahoma (from extremely high to not quite as high). I guess it is either very good or very bad to live on a coast. I'd wonder if the Gulf of Mexico were toxic, except that Florida falls right after New York in the list of low death rate states.
Probably more relevant, a characteristic that all the states with the high mortality rates share is relatively low levels of education.
Perhaps it is some consolation to Oklahoma that they currently have unusually low unemployment rates?
Probably more relevant, a characteristic that all the states with the high mortality rates share is relatively low levels of education.
Perhaps it is some consolation to Oklahoma that they currently have unusually low unemployment rates?
Subscribe to:
Posts (Atom)


